Objective
To repeat output and formatting for each row of data in a table.
Background Information
Often, when generating documents from data, we want to display or format each row of data the same way as the last. That's what the ForEach tag is for. It allows you to say "For each row of data, do this."
Pre-requisites
Inserting a TagProcedure
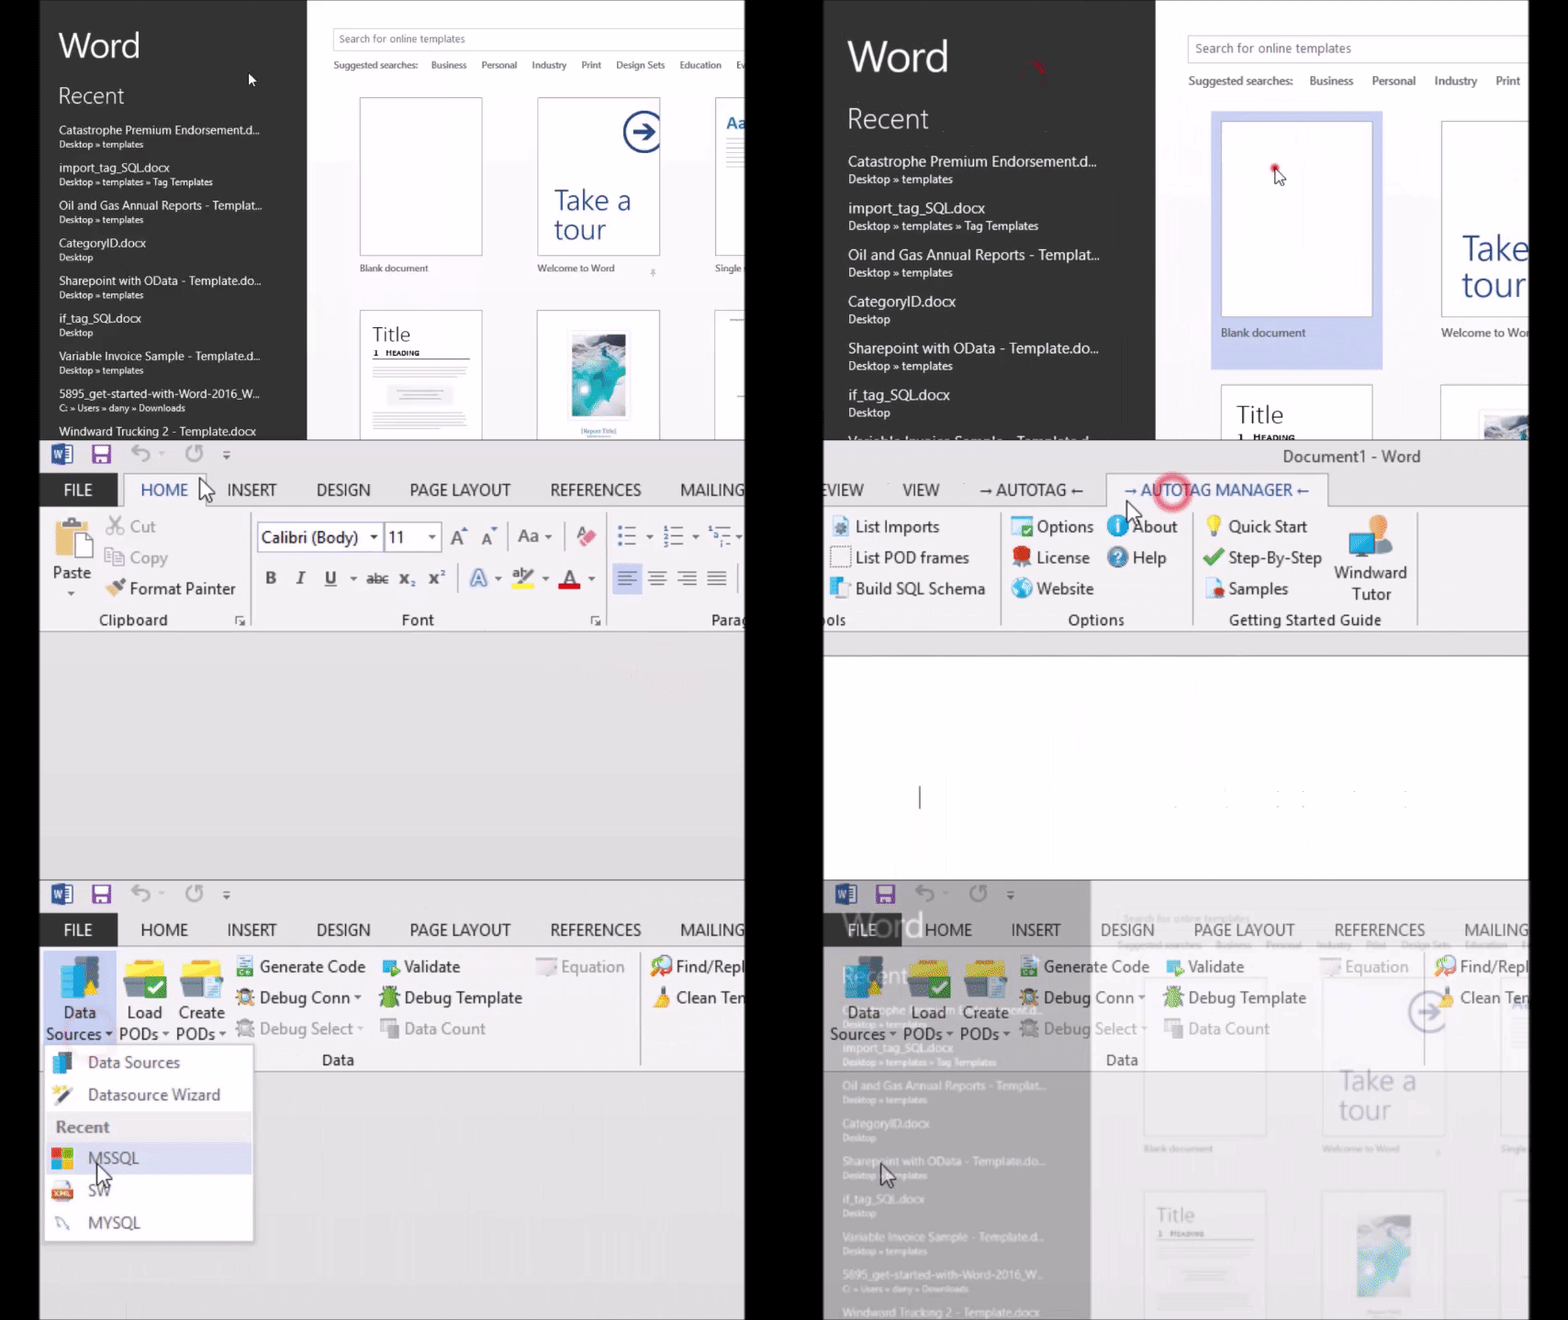
1. Load the sample MSSQL datasource
First we want to insert a datasource. For this tutorial, we'll be using the MSSQL sample. If it isn't in the drop-down list of datasources on the AutoTag Ribbon, you can add it yourself by following the Creating a SQL Datasource tutorial.
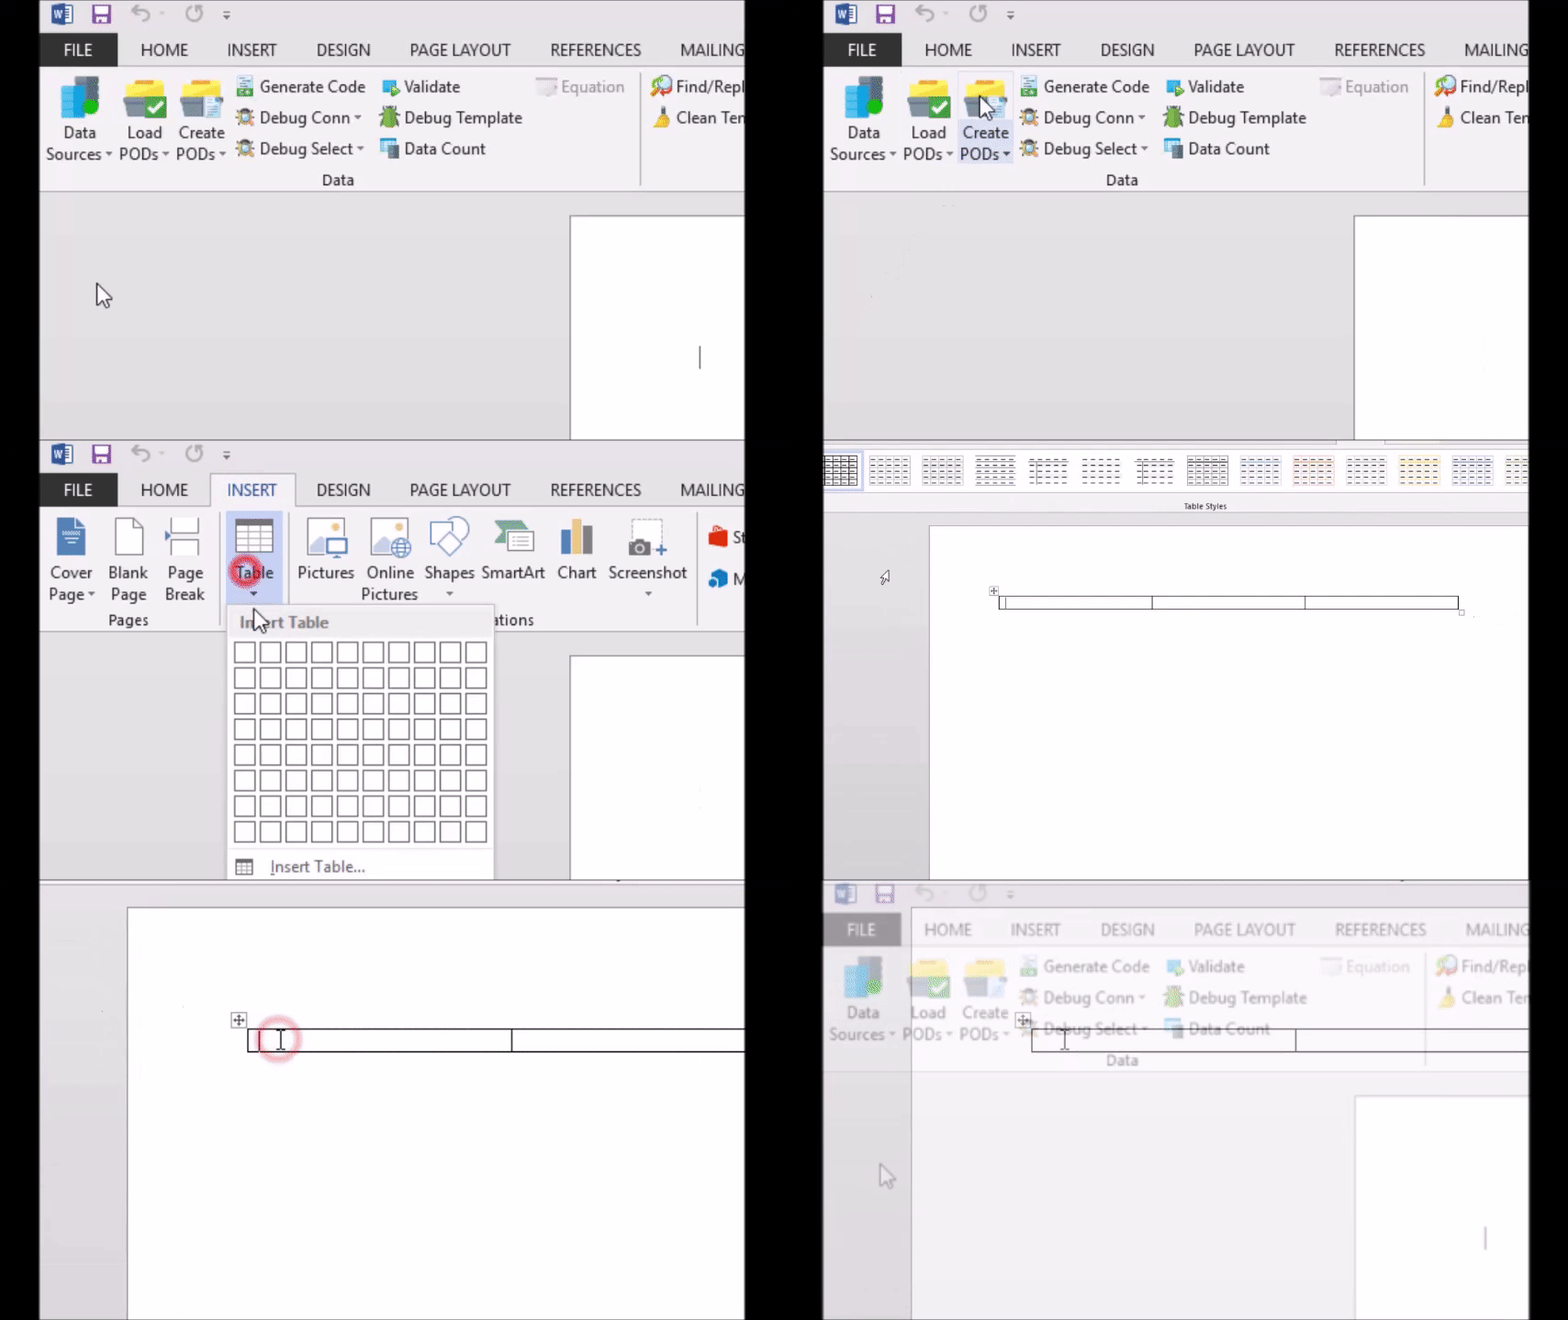
2. Insert a 3X1 table
We will use a 3X1 table to display our data--the ForEach tag will automatically expand the number of rows to fit our data when we generate the document.
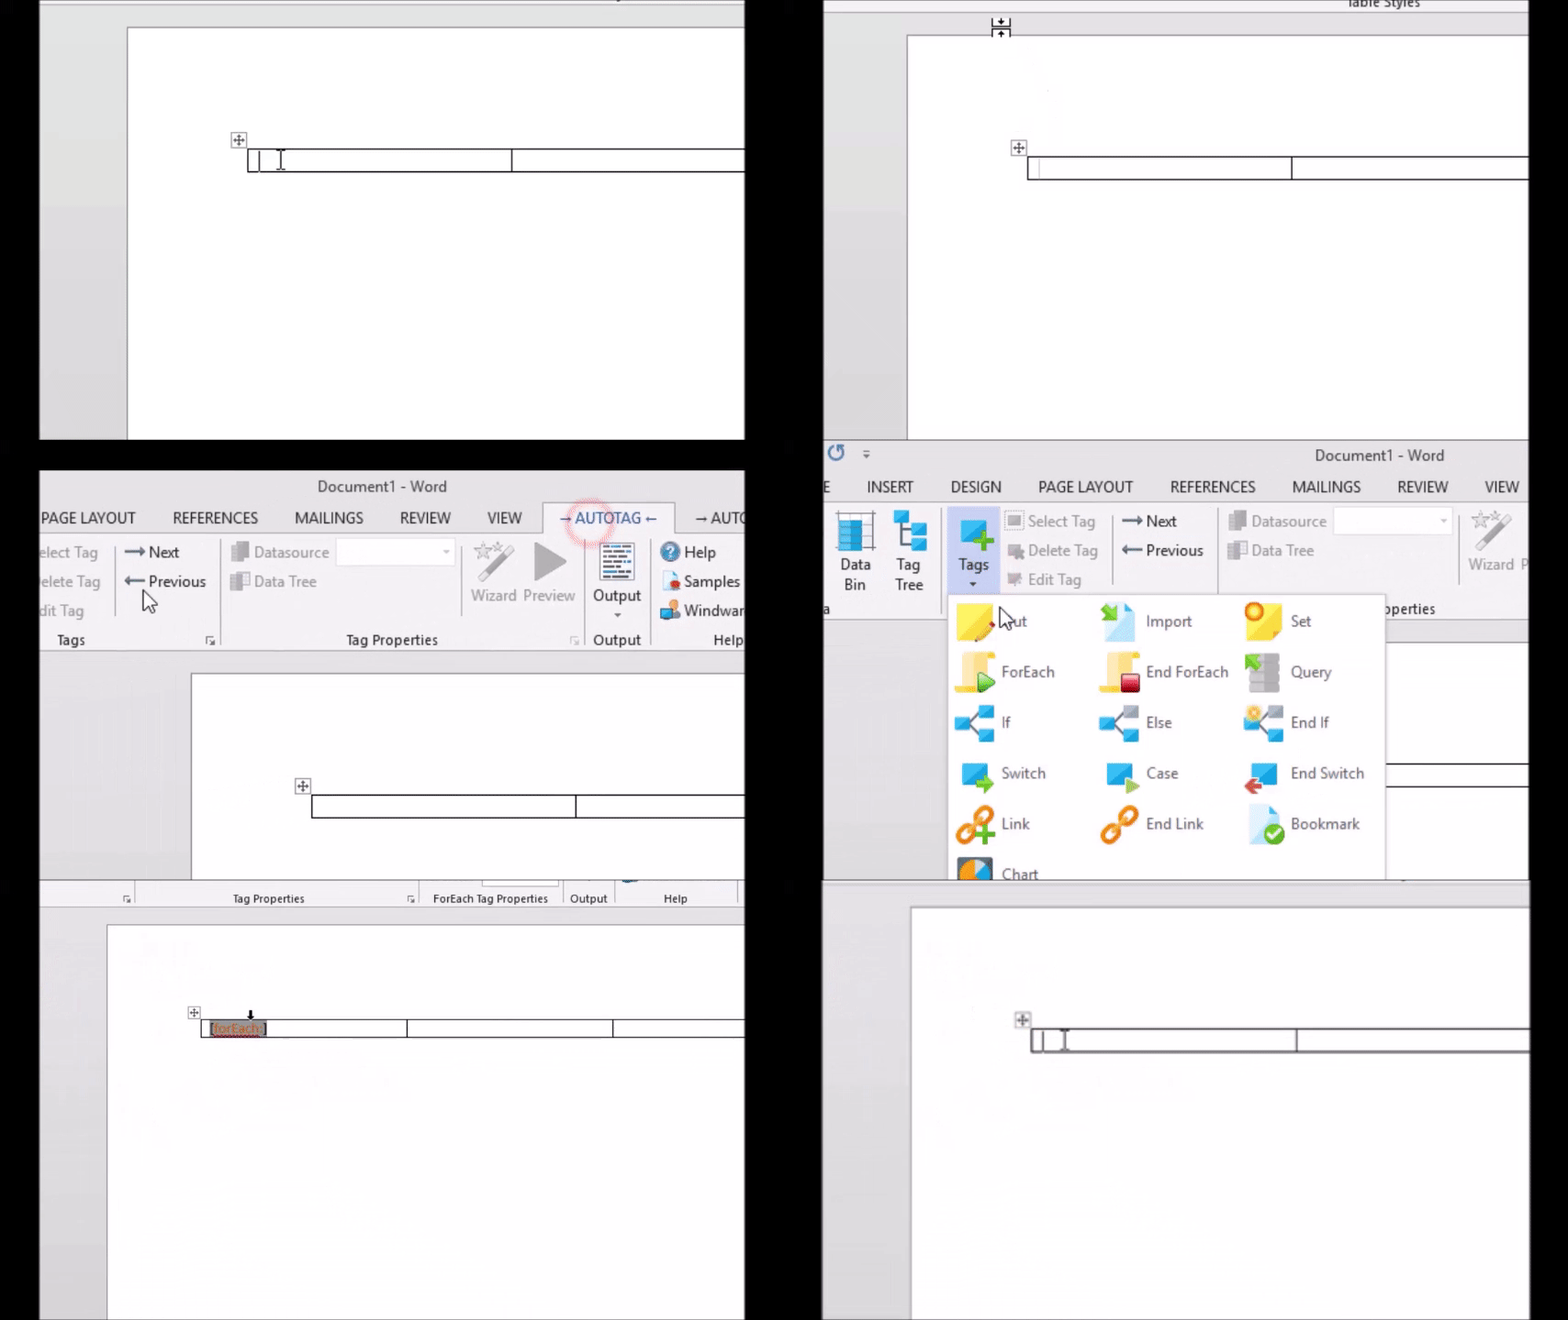
3. Insert a "ForEach" tag in the first column
4. Insert an "End ForEach" tag below the table
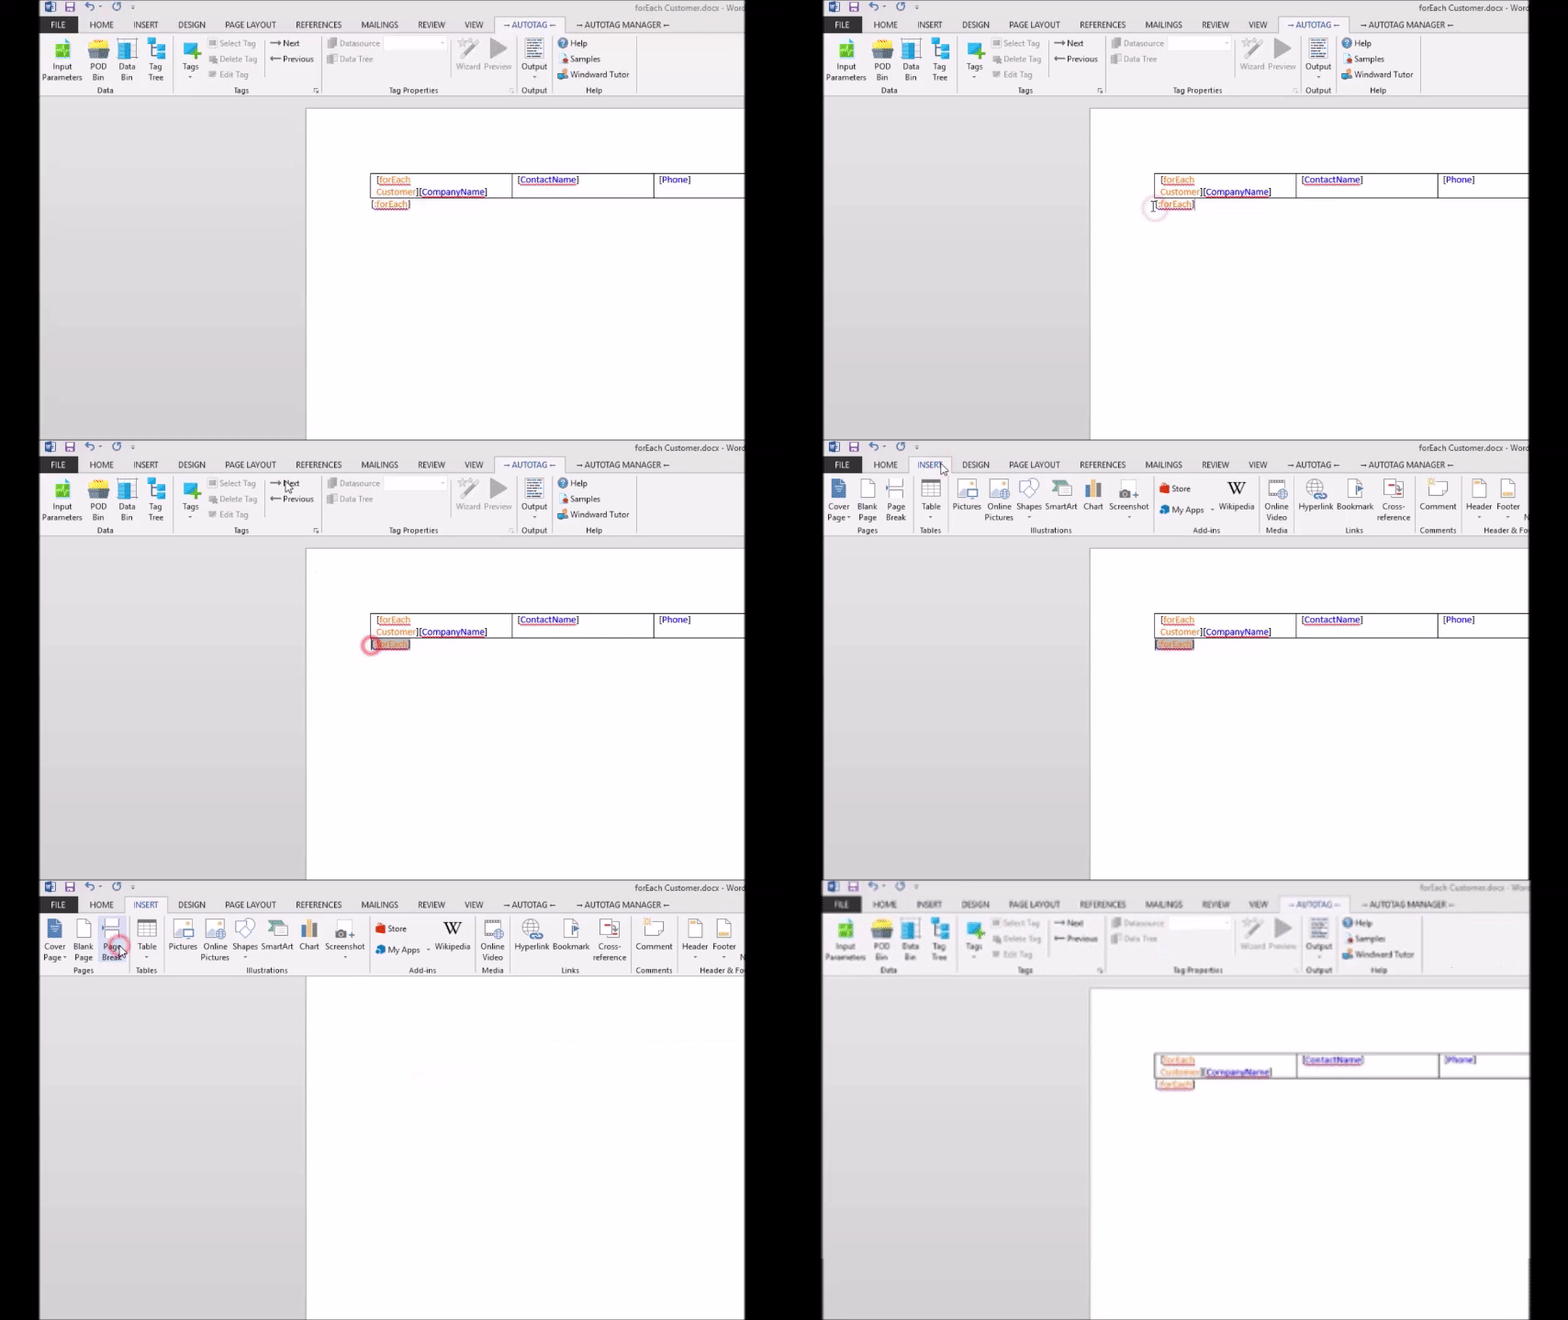
The position of the End ForEach tag determines how the format will be expanded. By placing the End ForEach tag on the line directly after the table, the ForEach tag will add a new row to the table for each row of data in the database. As you will see in the Extra Credit steps at the bottom, placing a page break causes each row of data to appear on separate pages.
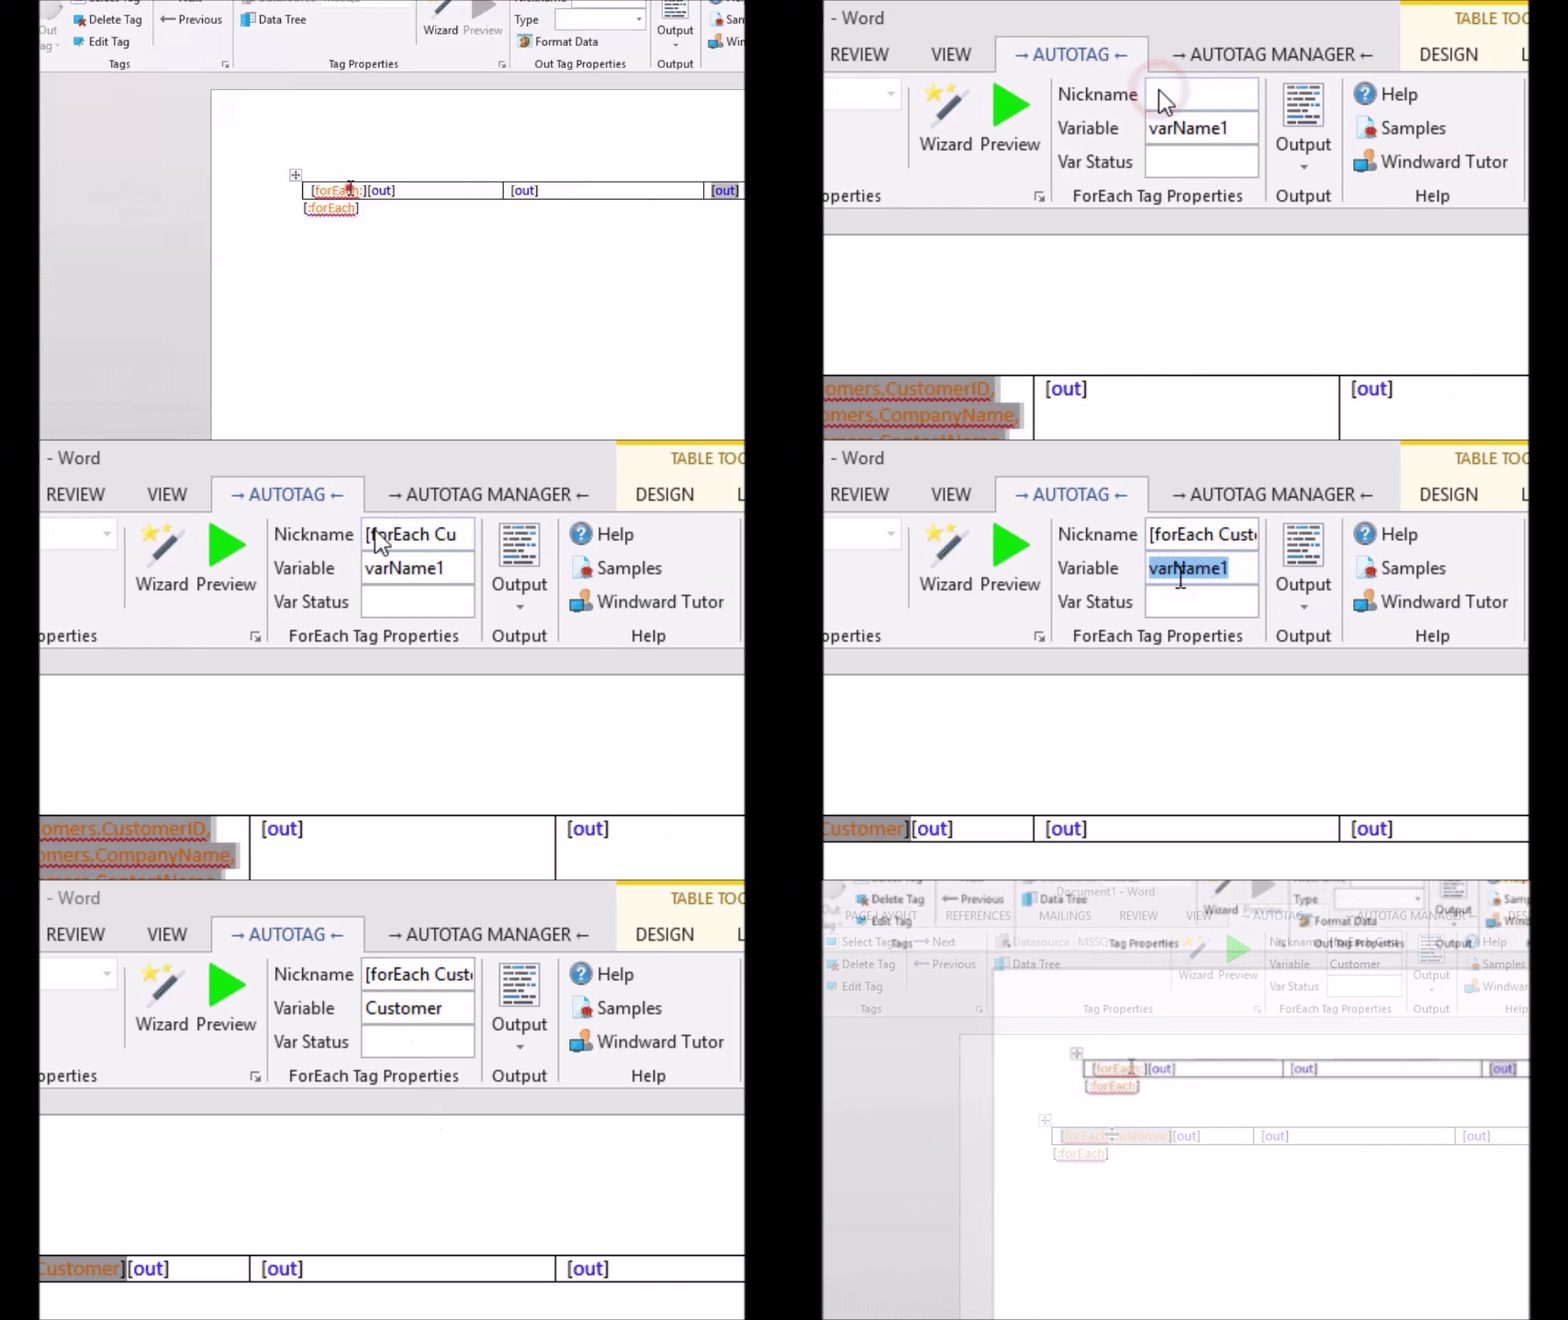
5. Insert Out Tags in Each Column
For now, only insert the tags. We will assign data to them in step 7.
6. Select a Table for the ForEach Tag
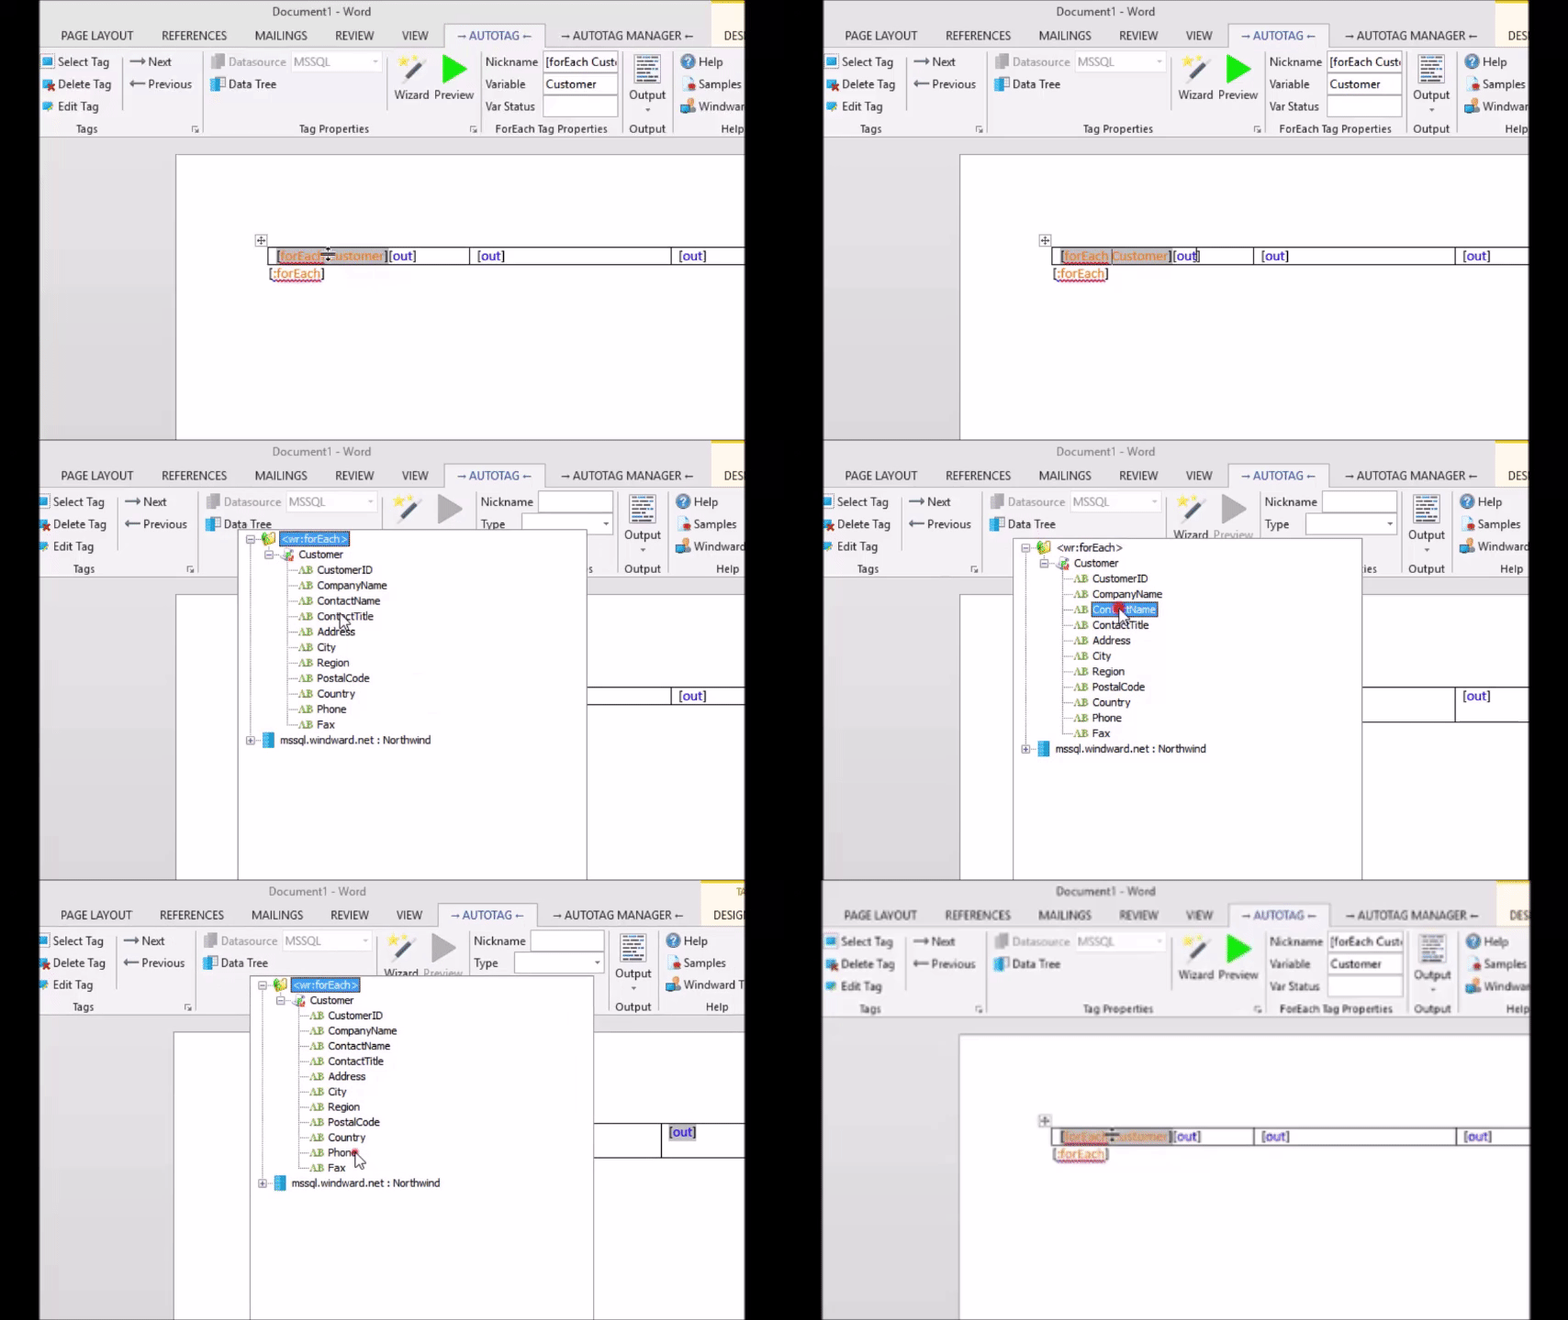
Now, we will select data for the ForEach tag to loop through by selecting a table from the "Data tree." This will query the data and make it available to the out tags that we will alter next.
We also want to name the ForEach tag's "variable" which is the same name we will use to access the data in the Out tags. For this example, select the "Customers" table and name the variable "customer." You can also assign a nickname so the tag doesn't look bad in the template. In this example, we use "[forEach Customer:"
7. Binding Data to the Out Tags
Binding data to Out tags inside of a ForEach tag pair is almost identical to the way we bind data otherwise. Open the data tree and find the column of data you would like to display. With ForEach tags, you select that column under the ForEach tag's variable instead of in the normal place in a table. For this, we use ContactName, CompanyName, and Phone
8. Save the Document
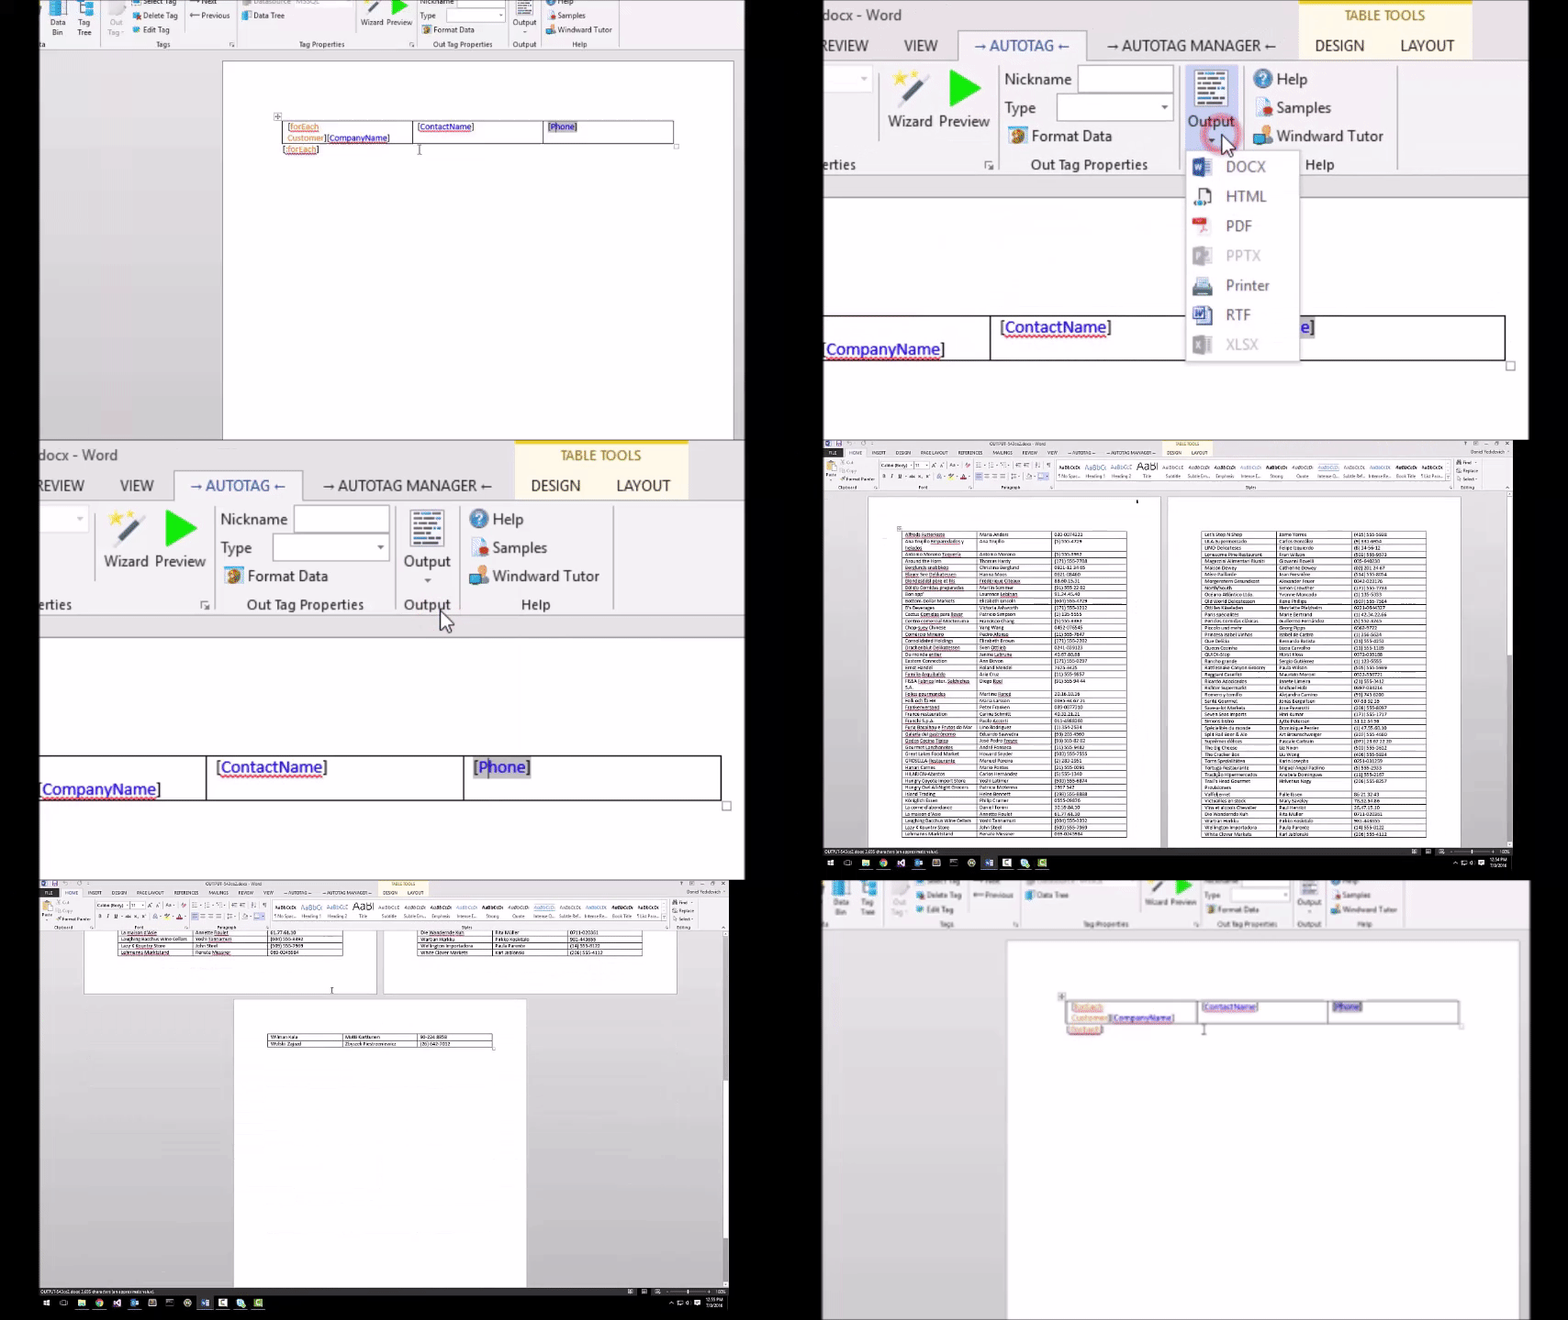
In order to generate a report, we need to save the document. Do so and save it wherever you would like.
9. Generate Output and View Results
Click the "Output" button in the AutoTag ribbon, then click the "PDF" menu item in the drop-down menu to generate a PDF document. After the report is finished, check out the results!
10. Extra-Credit: Add a Page Break to Separate Data
For this step, simply place a page break between the table and the End ForEach tag, This will separate the output so that only one row displays per page.
11. View the Extra-Credit results
Generate a document again just like before. Notice each row is on its own page. This is useful if you are doing something such as printing a batch of invoices where each invoice needs to be on a separate page.
